Plots
xDash integrates the Plotly.js (https://plot.ly/javascript/) library. Simplified usage (array actuators) is available for Plotly line, Plotly bar, Plotly pie and Plotly 3D surface. Otherwise, use the Plotly generic for a complete Plotly.js options and configurations.
They share common parameters, especially hideModeBar which allows to hide plot options toolbar at dashboard play.
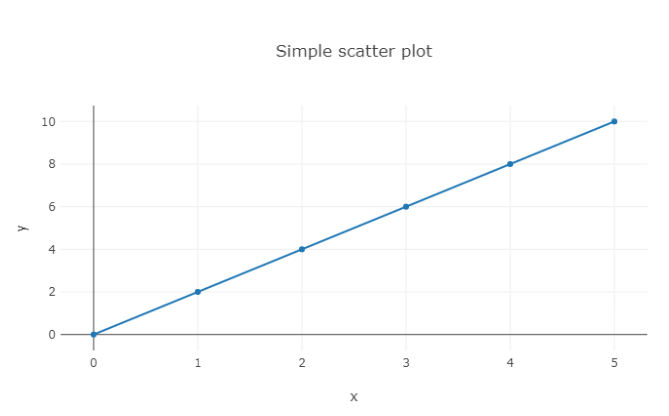
Plotly line
Allows to quickly display line charts, when x and y axis are expressed as arrays of numbers. The parameter numberOfAxis allows to specifiy up to 8 y-axis actuators (named y1 to y8), sharing the same x-axis actuator (named x). Widget layout may be configured in the "Graphical properties" tab.
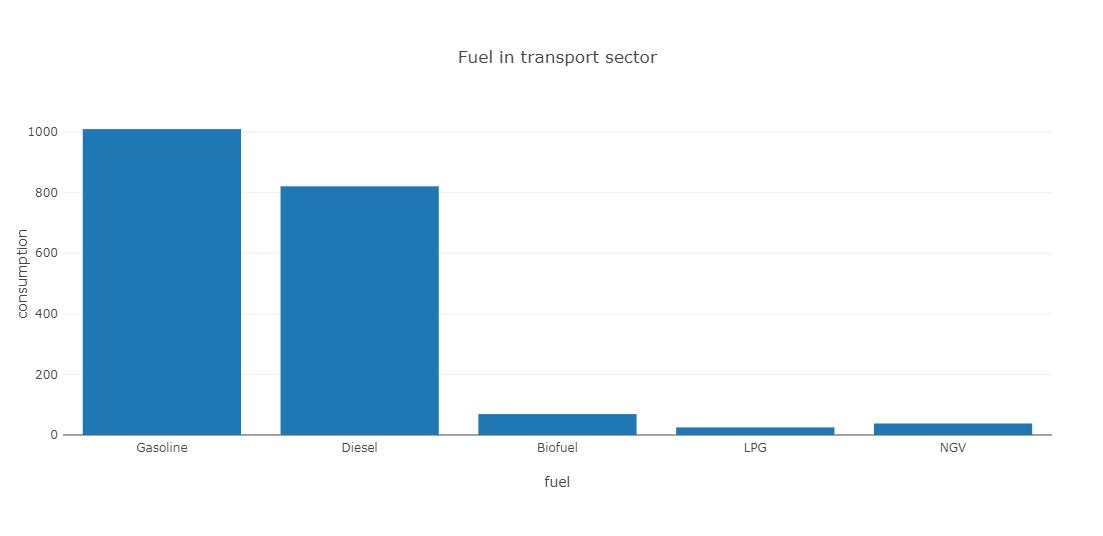
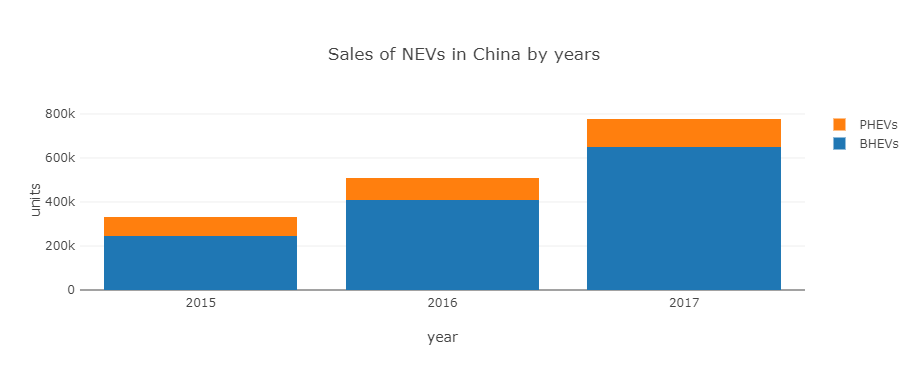
Plotly bar
Here parameter numberOfAxis allows to specify couples of x and y axis actuators (named x1, y1 to x8, y8).
Some examples :
Plotly pie
This widget has three actuators :
- values: an array of values to be displayed as pie chart
- labels: an optional array of labels associated to values
- Colors: an optional array of HTML-based colors used for each value display
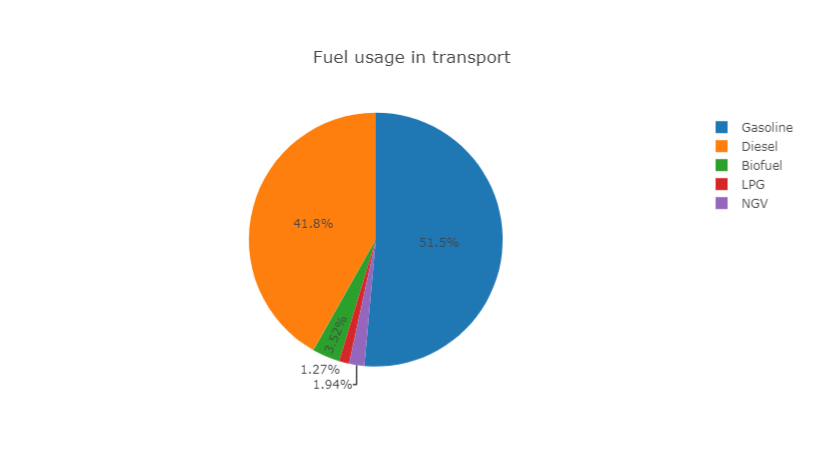
Example :
Plotly 3D surface
This widget has three actuators :
- x: 1-D numeric array of size N
- y: 1-D numeric array of size M
- z: 2-D numeric array (an M-size array of N-size arrays)
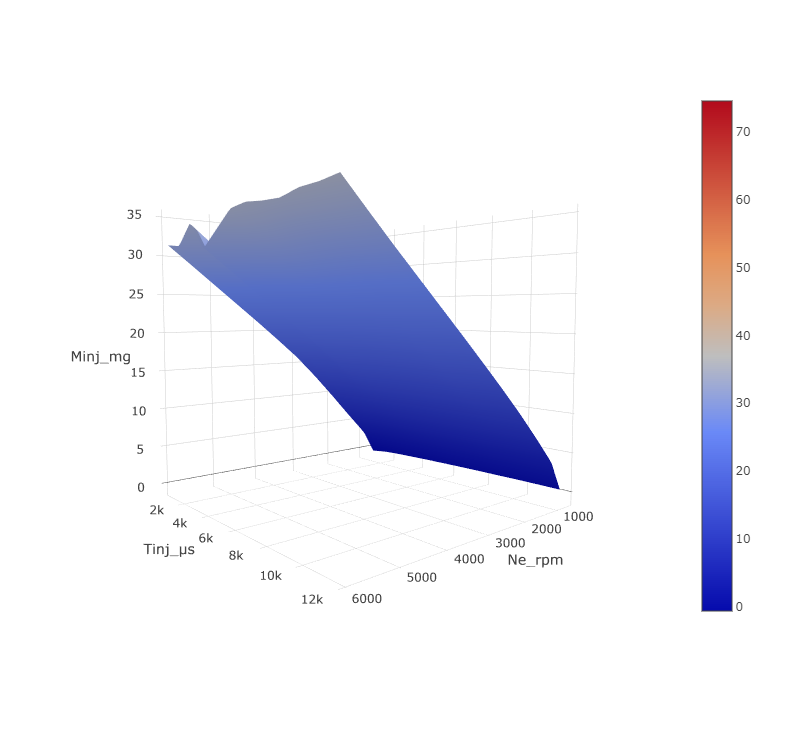
Example : 3d-surface.xprjson
Plotly generic
This widget accepts two actuators : data and layout. In opposite to previous Plotly-based widgets, layout cannot be set from "Graphical properties" tab. This brings more expressive power for layout specification using programming dataNodes.
Defining data and layout is illustrated in plotly.js documentation.
Some examples:
Vega
In the same spirit as Plotly generic widget above, you can visualize Vega specifications and connect them to data from other dataNodes.
Browse Vega examples gallery. Copy and paste the appropriate visualization to a JavaScript Formula dataNode. Finally, connect this dataNode to the specification widget actuator.
In this examples gallery, data is typically read from URL referenced sources using the Vega url keyword. You can connect to xDash dataNodes using the Vega values keyword instead.
Be aware when copying examples that URLS in these examples use relative paths. For proper execution on xDash, the absolute data path needs to be used (e.g. use 'https://vega.github.io/vega/data/movies.json' instead of 'data/movies.json').
Some examples:
ECharts
Simply, copy and paste the needed visualization from ECharts examples gallery to a JavaScript Formula dataNode. This example shall return an option JSON according to ECharts grammar. Finally, connect this dataNode to the option widget actuator.
Some examples: